Gustavo Varela Alvarenga
  • Bio
  • R Code
  • Shiny
  • Papers
  • Experience
  • Education
  • Recent & Upcoming Talks
    • Example Talk
  • Projects
  • Blog
    • 🎉 Easily create your own simple yet highly customizable blog
    • 🧠 Sharpen your thinking with a second brain
    • 📈 Communicate your results effectively with the best data visualizations
    • 👩🏼‍🏫 Teach academic courses
    • ✅ Manage your projects
  • Projects
    • Pandas
    • PyTorch
    • scikit-learn
  • Education
  • Experience
  • Teaching
    • Learn JavaScript
    • Learn Python
  • Shiny Apps
    • Dados Coronavirus Dashboard
    • Shiny App to Compare Images
    • Shiny App to Dinamically Add/Remove variables to a data frame.
    • Shiny App with Modal, Modules and jQuery
  • Code
    • Map of deforestation in Brazil
    • Waterfall chart in R
    • Dumbbell/Lolliplot of the social media age gap
  • Publications
    • Impacts of the Brazilian Science and Technology Sector Funds on industrial firms’ R&D inputs and outputs: New perspectives using a dose-response function
    • Demand for air ticket in the Brazilian economy: a co-integration analysis (original title: Demanda por ticket aéreo na economia brasileira: uma análise de co-integração)
    • Counter-cyclical policies in the automobile industry: a co-integration analysis of the impacts of IPI reduction on vehicle sales (original title: Políticas anticíclicas na indústria automobilística: uma análise de co-integração dos impactos da redução do IPI sobre as vendas de veículos).

Dados Coronavirus Dashboard

Oct 20, 2021·
· 1 min read
Code
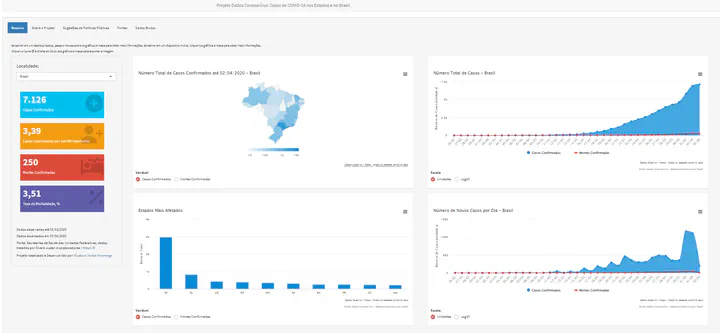
Image credit: Author

You can access this app and its code in https://gustav.shinyapps.io/dadoscoronavirus/

Last updated on Oct 20, 2021
Shiny App
Authors
Regional Head of Data Science for Latin America

Shiny App to Compare Images Jul 24, 2018 →

© 2024 Gustavo Varela Alvarenga. This work is licensed under CC BY NC ND 4.0

Published with Hugo Blox Builder — the free, open source website builder that empowers creators.