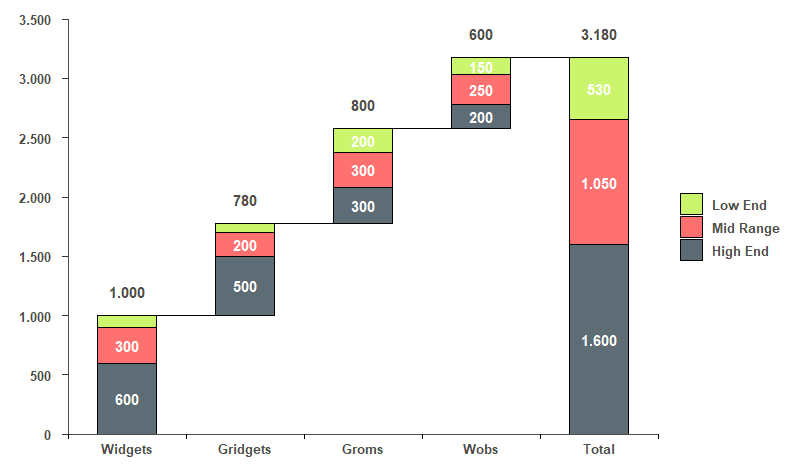
Waterfall chart with ggplot2
A stacked waterfall built from scratch with geom_rect, with running totals printed above each bar.
Download .R ↓Some of the R packages I have used for data visualization:
A few self-contained ggplot2 walkthroughs. Each link downloads the full, runnable R script.
A stacked waterfall built from scratch with geom_rect, with running totals printed above each bar.
Download .R ↓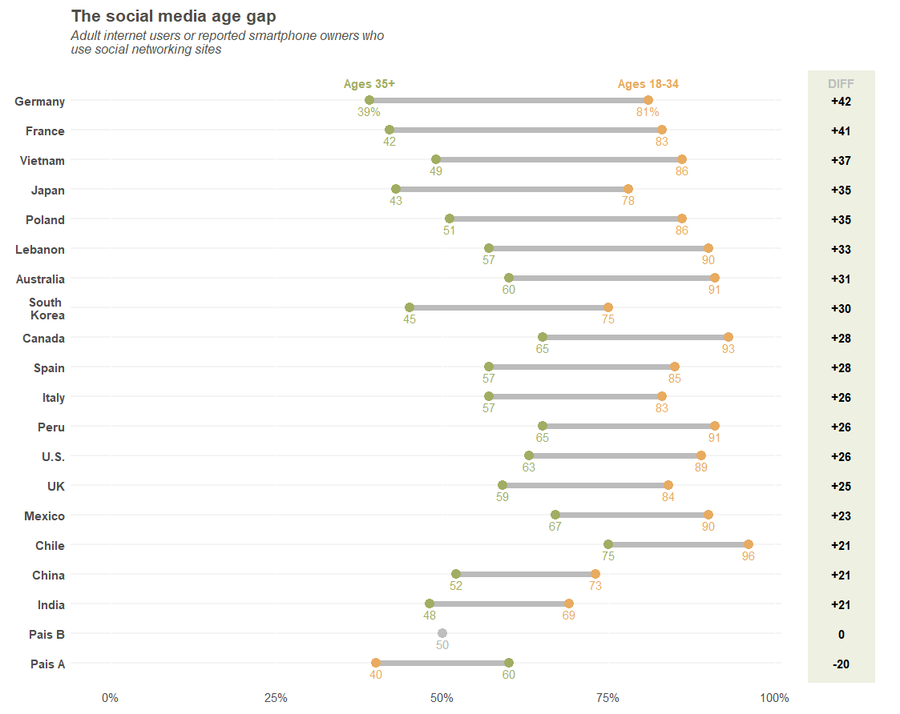
A two-point dumbbell plot comparing values across groups with geom_point and geom_segment.
Download .R ↓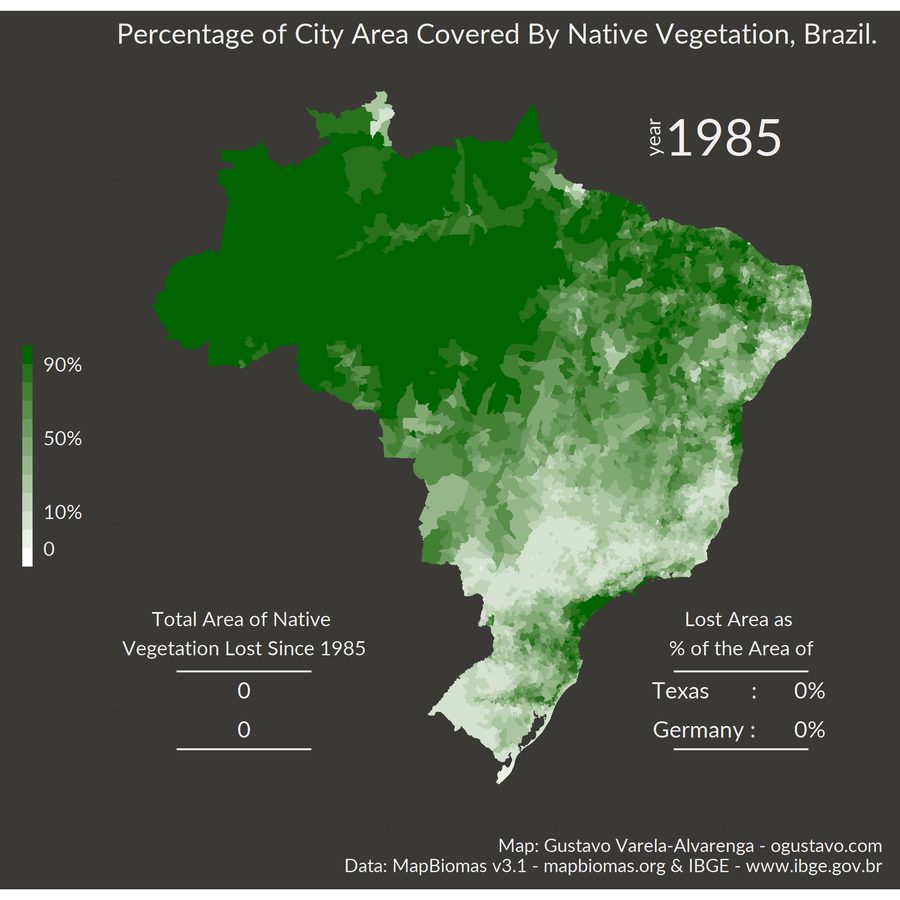
A choropleth of native-forest loss rendered with ggplot2 and animated frame-by-frame into a GIF.
Download .R ↓